
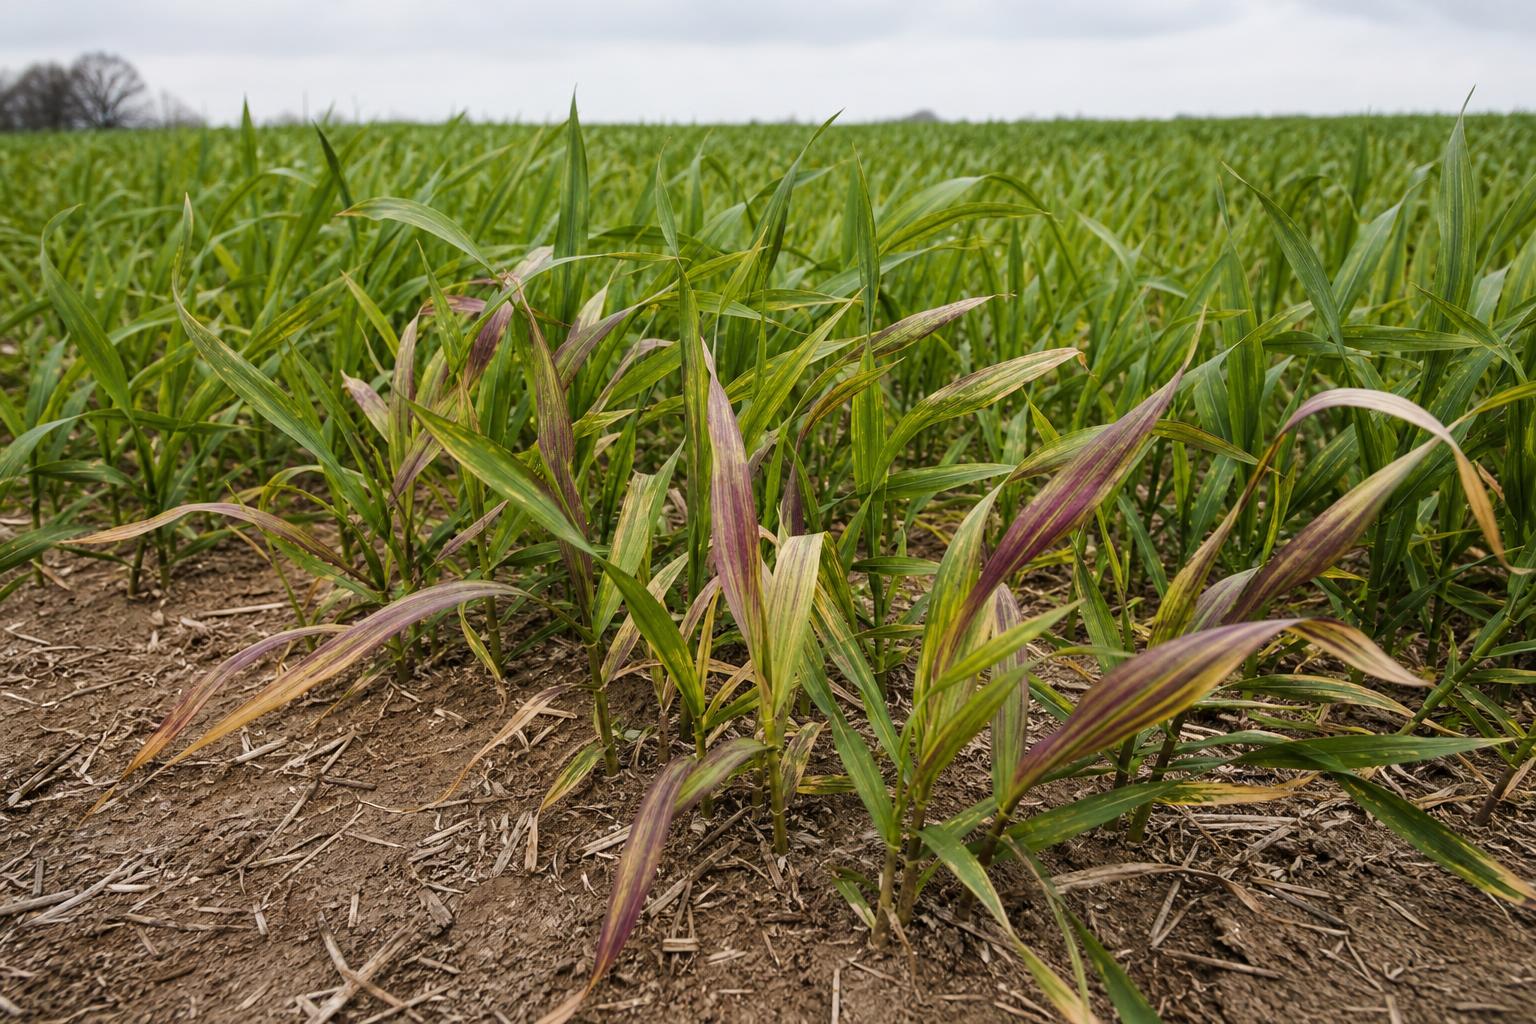
Phosphorus deficiency in crops is one of the most common yield limiters worldwide, yet it is easy to misdiagnose. Stunted seedlings, dark or purple leaves and slow maturity can also come from cold soil, compaction, root disease, herbicide injury or a nitrogen shortage. Treating the wrong problem wastes money and leaves the real constraint in place. This guide links what you see in the paddock to what a soil test and tissue test can confirm, and then to phosphate options that suit the result. It is written for growers, resellers and agronomy businesses buying in commercial quantities, and it flags where practice differs between regions and soil types. Always interpret results with a local agronomist, because critical values vary by test method, crop and country.
In this article
- Key takeaways
- How phosphorus deficiency in crops shows up in the field
- Why crops run short: low phosphorus soil versus locked-up phosphorus
- Confirming phosphorus deficiency in crops with soil and tissue tests
- Symptom-to-soil-test cheat sheet
- Phosphate options: DAP, MAP, compound NPK and blends
- DAP or MAP: matching the product to soil pH and crop
- Rates, placement and timing for correcting low phosphorus soil
- Ordering phosphate in bulk and matching it to your soil test
- Diagnosis mistakes that waste phosphate
- Conclusion
Key takeaways
- Phosphorus deficiency symptoms (stunting, dark green or purple leaves, delayed maturity) are not unique to phosphorus, so confirm with a soil test and, where useful, a tissue test.
- Low phosphorus soil and locked-up phosphorus are different problems. pH, soil chemistry and cold or wet conditions can limit uptake even when the soil holds plenty of total phosphorus.
- Soil test results are method-specific. A Colwell, Olsen, Bray or Mehlich-3 number must be compared with critical values for that same method, crop and soil type.
- DAP and MAP are the main concentrated phosphate sources. The better choice depends on soil pH, seed placement and how much nitrogen the crop needs at sowing.
- Match the phosphorus rate to the test result and expected crop removal, not to habit. A custom blend can combine phosphorus with the other nutrients your soil test flags.
How phosphorus deficiency in crops shows up in the field
Phosphorus drives energy transfer inside the plant and is critical for root growth, flowering and grain or fruit set. Because young plants have small root systems and often grow in cold soil, deficiency usually appears early in the season.
Early-season signs
Typical phosphorus deficiency symptoms include slow emergence and establishment, short or thin stems, fewer tillers in cereals, small dark green leaves and delayed flowering. Phosphorus is mobile inside the plant, so the crop moves it from older leaves to new growth. That is why symptoms often start on the older, lower leaves and may show as a dull bluish-green cast, reddening or leaf tip burn.
Purple leaves and phosphorus: what the colour does and does not tell you
Purple or reddish leaves occur when sugars build up and plants produce anthocyanin pigments. Purple leaves linked to phosphorus are real, but the same colour appears with cold nights, root damage, waterlogging, insect feeding, some herbicides, and in hybrids or varieties that naturally colour up. Treat purple as a prompt to investigate, not as a diagnosis. Check whether the pattern follows soil type, previous fertiliser history or compaction, rather than weather alone.
Differences between crops
- Cereals: reduced tillering, slow early growth and pale or reddish older leaf tips.
- Maize: purple tinge on lower leaves of young plants, uneven cobs and poorly filled tips in severe cases.
- Canola and other oilseeds: poor early vigour and purple-red colouring on leaf undersides and margins.
- Legumes and pasture: small dark leaves, poor nodulation and clover that thins out over time.
- Vegetables and tree crops: small leaves, weak root systems, delayed fruit set and lower yield without dramatic colour.
Mild deficiency can reduce yield with no visible symptoms at all, often called hidden hunger. That is one reason testing matters more than looking.
Why crops run short: low phosphorus soil versus locked-up phosphorus
A crop can be short of phosphorus for two quite different reasons. The soil may truly be low in phosphorus, or the phosphorus may be present but not available to roots. The fix differs, so separate them before you order fertiliser.
Total phosphorus is not available phosphorus
Plants take up phosphorus mainly as dissolved phosphate ions in soil water. Only a small fraction of the total phosphorus in a soil is in that form at any time. Most is held on mineral surfaces, in organic matter or in slowly soluble compounds. Old paddocks with a long history of phosphate fertiliser may therefore show high total phosphorus and still produce a deficient crop in a bad season.
How pH and fixation tie up phosphate
Phosphate is generally most available at a soil pH of roughly 6 to 7 (measured in water). In strongly acid soils, iron and aluminium compounds bind phosphate. In alkaline or calcareous soils, calcium compounds do the same. Soils with a high phosphorus buffering capacity, common in red, clay-rich and iron-rich soils in many regions, fix more of each fertiliser application and need larger inputs to raise the test value.
Conditions that mimic or worsen deficiency
- Cold, wet or waterlogged soil that slows root growth and phosphate diffusion.
- Compaction or shallow roots that limit the volume of soil explored.
- Dry topsoil, particularly in no-till systems where phosphorus is concentrated near the surface.
- Long fallow, which can reduce beneficial mycorrhizal fungi in some crops.
- High-yielding crops that remove more phosphorus than has been replaced over several seasons.
Confirming phosphorus deficiency in crops with soil and tissue tests
A soil test turns a suspicion into a number you can act on. The key is to use the right method and read it in context. For a field-by-field walkthrough of reports, see our guide on how to read a soil test report.
Choosing and reading the soil test method
Laboratories use different extractants, and their numbers are not interchangeable.
- Colwell P: widely used in Australia, normally read alongside a buffering index.
- Olsen P: common internationally, especially for neutral to alkaline and calcareous soils.
- Bray-1 P: used in many regions for acidic to neutral soils.
- Mehlich-3 P: a multi-nutrient extractant used in many countries.
Always compare your result with critical values for the same method, crop and soil type from a local source. A figure that is adequate for one method can be deficient for another.
Context tests that change the answer
Ask for pH, a phosphorus buffering index (where your lab offers it), organic matter and, in calcareous soils, free carbonate. Check zinc as well. Zinc deficiency can look like phosphorus deficiency, and very high phosphorus can aggravate zinc shortage in sensitive crops.
Sampling and tissue testing that hold up
Sample the topsoil (commonly 0 to 10 cm, or 0 to 4 inches), and in no-till paddocks consider splitting shallow and deeper layers because phosphorus stratifies. Take paired samples from good and poor areas, plus a composite of at least several cores per zone. A tissue test, using the youngest mature leaf or the plant part specified for that crop at a defined growth stage, shows whether the crop is actually taking phosphorus up. Compare it with reference ranges for the same crop and stage.
Symptom-to-soil-test cheat sheet
Use this table as a starting framework when walking a paddock with a soil sampler. It does not replace local agronomic advice.
| What you see | Other possible causes | Test to run | If phosphorus is confirmed |
|---|---|---|---|
| Stunted seedlings with dark green or purple older leaves | Cold soil, compaction, root disease | Soil P, pH, buffering index; check roots | Place phosphate in the seed row or band at sowing |
| Poor tillering in cereals on acid soil | Aluminium toxicity, nitrogen shortage | Soil P, pH (calcium chloride or water), aluminium | Phosphate plus liming strategy if pH is limiting |
| Patches of purple on a high-pH or calcareous soil | Zinc or iron deficiency, waterlogging | Olsen P, free carbonate, zinc, tissue test | Acidifying phosphate such as MAP, banded near roots |
| Normal colour but lower yield on high-removal crops | Water stress, other nutrient limits | Soil P trend over seasons, tissue test | Maintenance phosphate at or above crop removal |
| Clover thinning in pasture | Sulphur or molybdenum shortage, grazing pressure | Soil P, sulphur, pH | Phosphate with sulphur where the test supports it |
Phosphate options: DAP, MAP, compound NPK and blends
Once phosphorus is confirmed, the question becomes which product delivers it most usefully for your crop, soil and application method.
DAP and MAP as concentrated phosphate sources
Diammonium phosphate (DAP) and monoammonium phosphate (MAP) are the most widely traded high-analysis phosphate fertilisers. Both supply water-soluble phosphate plus ammonium nitrogen, so they suit sowing applications where roots need early phosphorus. Our pages on buying DAP fertiliser in Australia and the supply side explain how bulk loads work.
Compound NPK and custom blends
Where soil tests show more than one gap, a compound NPK or a blended fertiliser can supply phosphorus alongside nitrogen, potassium and sulphur in one pass. Compound granules carry every nutrient in each granule, while blends allow ratios to be tuned to a specific test. Natures Fertilizer blends in Hamilton, South Australia, and can match a blend to your soil test. For the trade-offs, read about custom fertiliser blending from soil test to order.
Organic and biological sources
Organic and biological organic fertilisers can contribute phosphorus and improve soil biology, but they release nutrients more slowly and at lower concentrations. They suit longer-term building and certain production systems. If you need a fast response for a deficient seedling crop, a soluble phosphate source is usually more reliable. Certification rules for organic production differ between countries, so check your market requirements.
DAP or MAP: matching the product to soil pH and crop
Both products work. The difference lies in what happens around the granule and how much nitrogen comes with the phosphorus.
Soil pH and seedling safety
DAP dissolves to create a temporarily alkaline zone around the granule, which can release free ammonia and harm germinating seedlings if placed in contact with seed, particularly at high rates or in dry, light soils. MAP creates a mildly acidic zone, which can help in high-pH and calcareous soils and is generally gentler at the seed row. On acidic soils the pH effect near the granule is small compared with the whole-soil pH, so liming and buffering matter more. Our comparison MAP vs DAP fertiliser goes deeper on crop fit.
Nutrients per tonne
Typical grades are shown below. Actual analysis varies by source, so check the Certificate of Analysis for the batch you receive.
| Product | Typical analysis (N-P2O5-K2O) | Approx. phosphorus (P) content | Granule zone reaction | Best fit |
|---|---|---|---|---|
| DAP | 18-46-0 | About 20% P (460 kg P2O5 per tonne) | Temporarily alkaline | Crops needing more nitrogen at sowing; keep away from seed at higher rates |
| MAP | 11-52-0 (some grades 10-50-0) | About 22 to 23% P | Mildly acidic | Alkaline or calcareous soils, seed-safe placement, higher phosphorus-to-nitrogen needs |
To convert, phosphorus (P) is about 43.6% of P2O5. Per kilogram of product, MAP delivers a little more phosphorus than DAP, while DAP delivers more nitrogen.
Rates, placement and timing for correcting low phosphorus soil
Rates depend on the soil test result, buffering, yield target and crop removal. Local trials and agronomic guidelines should set the actual figure.
Build-up versus maintenance
If the test is below the critical value, you need a build-up rate that raises soil phosphorus over several seasons, plus an amount for crop removal. If the test is already adequate, apply maintenance phosphate roughly equal to what the crop takes off. If the test is well above the critical value, you may skip a season, which is a legitimate way to avoid unnecessary spending.
Placement
Phosphate moves very little in soil. Banding near or below the seed puts phosphorus where young roots will find it and reduces fixation in high-buffering soils. Broadcasting suits pasture, established perennial crops and build-up programmes, but needs higher rates for the same response. Keep seed-row rates within the limits recommended for your crop and seeder, because salt and ammonia can injure seedlings.
A worked removal example
Wheat grain removes roughly 3 kg of phosphorus per tonne harvested (values vary by variety and region). A 4 t/ha crop therefore removes about 12 kg P/ha, equal to about 27 kg P2O5/ha. Replacing that with DAP means about 60 kg of product per hectare (about 54 lb per acre). This is an illustration of the arithmetic, not a recommendation, and it excludes any build-up requirement.
Ordering phosphate in bulk and matching it to your soil test
Natures Fertilizer Pty Ltd supplies growers, resellers and agronomy businesses in commercial quantities, not home gardeners. The product range includes DAP, MAP, compound NPK, water-soluble, blended and organic fertilisers, and potassium sulphate (SOP) for potassium and sulphur needs.
What to prepare before you enquire
- Soil test reports showing phosphorus method, pH and buffering where available.
- Crop, yield target and planting or application method (banded, broadcast or fertigation).
- Quantity needed and delivery or export destination.
- Any limits from your local regulations, certification scheme or import rules, which differ between countries.
How the process works
This website is a catalogue and enquiry point, with no online shop. Every enquiry receives an individual written quote, and the lead time is confirmed in that quotation. Minimum orders are 10 to 25 MT depending on product and destination, and a full 20ft container is about 25 MT. We deliver Australia-wide and arrange export worldwide. Payment is by bank transfer only, EFT within Australia and T/T for export. A Certificate of Analysis is available on request, so you can check the nutrient content against your agronomist’s plan.
Diagnosis mistakes that waste phosphate
Most failed phosphorus programmes trace back to a small number of avoidable errors.
- Diagnosing from colour alone. Purple leaves linked to phosphorus can look identical to cold stress or root damage. Confirm with a test.
- Using the wrong critical value. Comparing an Olsen result with a Colwell guideline gives a misleading answer.
- Ignoring pH. Phosphate will not perform in strongly acid or alkaline soil until the underlying chemistry is addressed.
- Applying only what is convenient. Rates should reflect the test, buffering and removal, not last year’s habit.
- Missing partner nutrients. Zinc, sulphur and nitrogen shortages can limit the response to phosphorus.
- Confusing nutrient sources. Potassium sulphate (SOP) supplies potassium and sulphur, not phosphorus, so it does not fix a phosphate shortage.
- Placing DAP too close to seed. This can cause seedling injury that looks like a nutrient problem.
Retest every few seasons, and test again after any change in rotation, tillage system or yield level. A trend in your results is more useful than any single number.
Conclusion
Phosphorus deficiency in crops is best handled as a diagnosis first and a purchase second. Field symptoms such as stunting and purple leaves point you to the problem, but soil tests, pH, buffering and tissue results confirm it. Once phosphorus is confirmed, DAP, MAP, compound NPK or a custom blend can be matched to soil chemistry, crop and placement method, with rates set by test values and crop removal. Retesting over time shows whether the programme is working.
Leave a Reply